
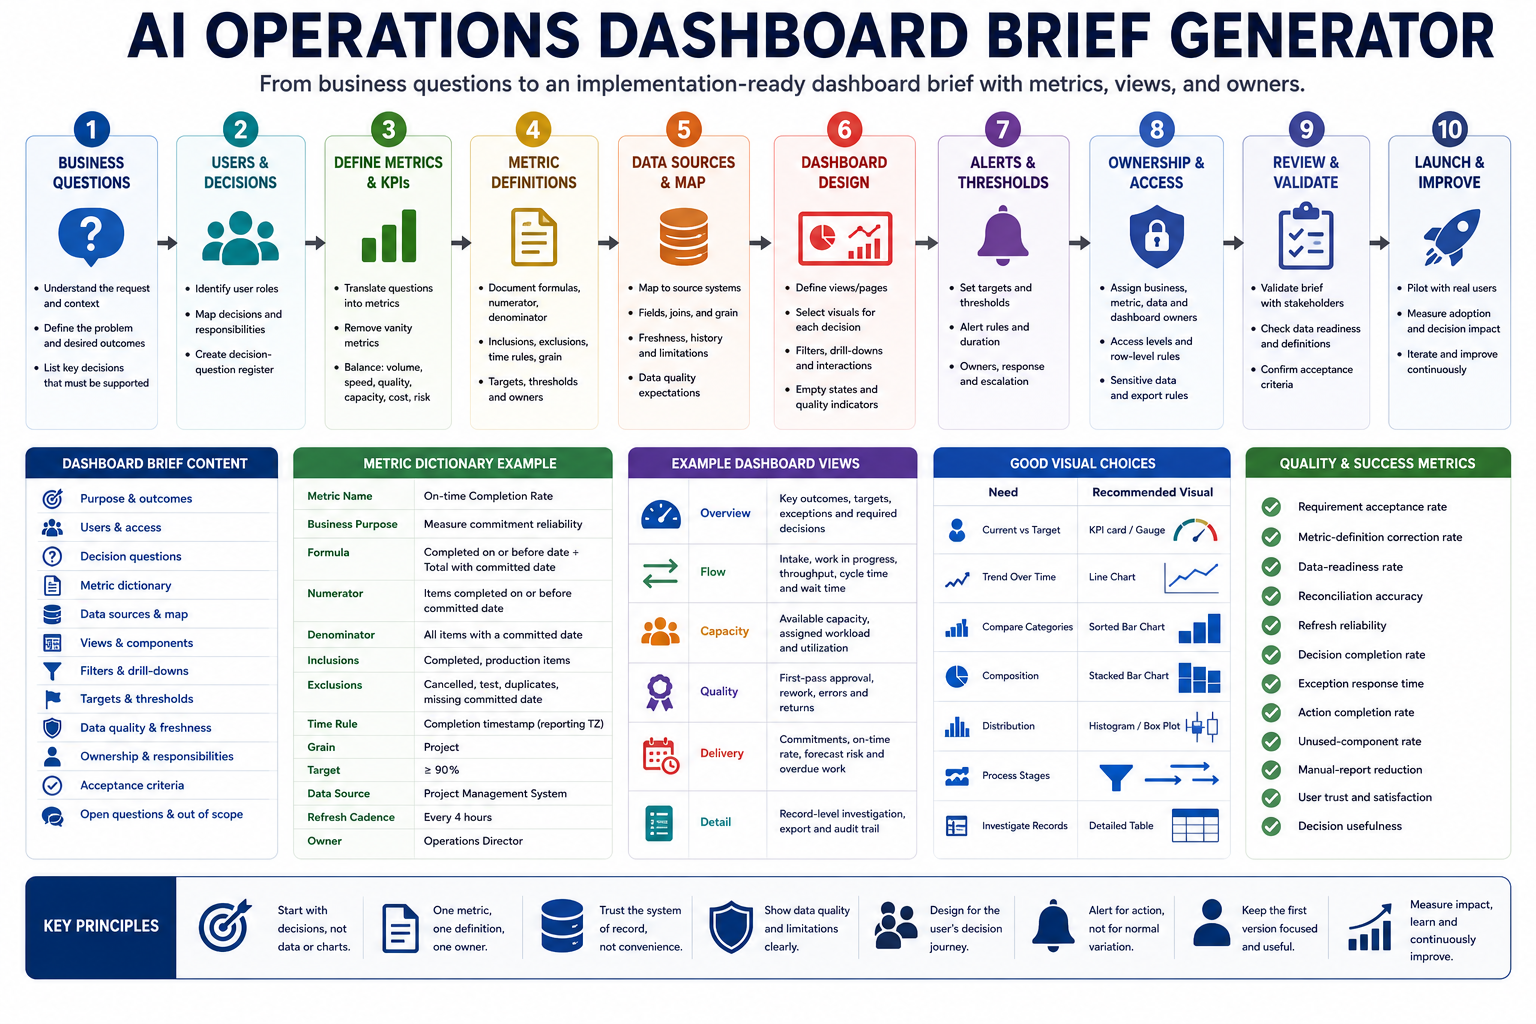
An AI operations dashboard brief turns unclear requests such as “show us how the business is doing” into an implementation-ready specification with decision questions, verified metrics, data sources, views, filters, thresholds, owners, access rules, and acceptance tests.
The goal is not to let AI invent key performance indicators or design a dashboard filled with attractive but unused charts. The goal is to help operators and analysts clarify what decisions the dashboard must support, document how every metric is calculated, expose missing data, and create a shared brief that business and technical teams can review before development begins.
Why operations dashboard projects fail
Most dashboard problems begin before a chart is created. A stakeholder requests visibility into performance, the analyst collects available numbers, and the final dashboard displays activity without helping anyone decide what to do.
Common failure patterns include:
- Starting with available data instead of operational decisions.
- Tracking metrics because another company uses them.
- Displaying vanity metrics without targets or consequences.
- Using the same metric name for different calculations.
- Combining data with incompatible dates, time zones, currencies, or reporting grains.
- Showing averages that hide important variation.
- Adding filters that do not change any decision.
- Using charts without explaining what action a change should trigger.
- Presenting incomplete data as current and reliable.
- Allowing different teams to maintain separate versions of the same KPI.
- Building executive, team, and analyst needs into one overloaded page.
- Launching without a named metric owner or dashboard owner.
- Sending automated alerts for normal variation.
- Measuring dashboard visits instead of decision usefulness.
A dependable dashboard should answer:
- Which operational decisions should become faster or more accurate?
- Who makes those decisions?
- Which verified metrics support them?
- What comparison, target, or threshold gives the metric meaning?
- Which dimensions explain why the result changed?
- How current and complete is the underlying data?
- Who investigates and acts when a metric changes?
Step 1: Define the dashboard purpose
Do not begin with a list of charts. Write a short dashboard purpose statement that connects the intended audience with the decisions they need to make.
This dashboard helps the operations team identify delayed client work, overloaded owners, and blocked projects early enough to reassign capacity before delivery commitments are missed.
A useful purpose statement includes:
- Audience: Who will use the dashboard?
- Operational scope: Which process, team, product, or region is included?
- Decision: What choice should the user make?
- Timing: How often is that decision made?
- Outcome: What should improve when the dashboard is used well?
Separate monitoring from analysis
| Dashboard purpose | Primary question | Typical output |
|---|---|---|
| Monitoring | Is the operation within its expected range? | Status, target comparison, and exceptions |
| Diagnosis | Why did a result change? | Breakdowns, trends, segments, and contributing factors |
| Planning | What capacity or resources will be required? | Forecasts, workload, demand, and scenarios |
| Accountability | Who owns the result and the next action? | Owners, due dates, status, and follow-up records |
| Executive review | Which outcomes, risks, and decisions require leadership attention? | High-level results, exceptions, and decision requests |
One dashboard may support more than one purpose, but each page or view should have a clear primary job.
Step 2: Identify users and their decisions
Different users need different levels of detail. A team lead may need individual workload and blockers, while an executive may need delivery risk and overall capacity.
| User | Decision | Required detail |
|---|---|---|
| Operations lead | Reassign work or remove a blocker | Project, owner, capacity, deadline, and dependency |
| Team manager | Balance workload and review performance | Team, person, work type, status, and trend |
| Finance partner | Review cost, budget, or margin variance | Amount, period, department, project, and forecast |
| Executive | Choose where leadership attention is required | Outcome, target, variance, risk, owner, and recommendation |
| Analyst | Investigate data and operational causes | Detailed dimensions, definitions, lineage, and export access |
| Frontline operator | Choose the next action | Assigned work, priority, due date, status, and instructions |
Create a decision-question register
For each dashboard user, document the operational questions they need answered.
| Decision question | Action supported | Decision owner |
|---|---|---|
| Which projects are likely to miss their committed date? | Escalate, rescope, or reassign | Operations lead |
| Which owners are above their approved capacity? | Move work or reduce commitments | Team manager |
| Which service lines are below the target margin? | Review pricing, cost, or delivery model | Finance and operations |
| Which blockers have remained open for more than seven days? | Escalate the dependency | Project owner |
| Which customer requests repeat without resolution? | Create a process or product improvement | Support lead |
A dashboard element should not enter the brief unless it supports a documented question, comparison, investigation, or action.
Step 3: Define the operational process being measured
Metrics become misleading when the underlying process is unclear. Map the operational flow before selecting KPIs.
- What event starts the process?
- Which stages does the work move through?
- Who owns each stage?
- Which handoffs occur?
- What counts as completion?
- Where does work wait?
- Which exceptions can occur?
- Which system records each event?
Example operational flow
| Stage | Entry event | Exit event | Owner |
|---|---|---|---|
| Request received | Valid request created | Request reviewed | Operations coordinator |
| Qualification | Review started | Accepted, rejected, or returned | Service owner |
| Execution | Work assigned | Deliverable submitted | Assigned operator |
| Review | Deliverable submitted | Approved or returned | Reviewer |
| Completion | Final approval recorded | Customer or stakeholder notified | Project owner |
This process map helps distinguish workload, throughput, cycle time, waiting time, quality, and outcome metrics.
Step 4: Translate business questions into metrics
Do not choose metrics because they are easy to calculate. Each metric should provide evidence for a documented decision question.
| Business question | Possible metric | Required comparison |
|---|---|---|
| Are we completing enough work? | Completed items or throughput | Plan, previous period, or available capacity |
| Is work moving quickly enough? | Median cycle time | Target or historical baseline |
| Where does work wait? | Time in status or queue age | Stage-level threshold |
| Are commitments being met? | On-time completion rate | Committed completion date |
| Is quality acceptable? | First-pass approval or rework rate | Quality target |
| Is workload balanced? | Assigned effort versus available capacity | Approved capacity limit |
| Are issues being resolved? | Open blocker age or resolution time | Escalation threshold |
| Is the operation financially sustainable? | Cost per unit, utilization, or contribution margin | Budget or target |
Use a balanced metric set
An operations dashboard usually needs several metric types:
- Volume: How much work entered or left the process?
- Speed: How long did work take?
- Quality: How much work was accepted without correction?
- Reliability: How consistently were commitments met?
- Capacity: How much work can the team realistically handle?
- Cost: What resources were consumed?
- Outcome: What meaningful result did the operation create?
- Risk: Which conditions may interrupt delivery?
Using only volume can encourage more activity without better quality. Using only speed can encourage premature completion. The brief should show the trade-offs that matter.
Step 5: Remove vanity metrics
A metric is not useful merely because it changes over time. Test every proposed metric against its operational value.
- Which decision changes when this metric moves?
- Who owns that decision?
- What target, baseline, or threshold gives the metric meaning?
- Can the responsible team influence the result?
- Does the metric measure an outcome, a useful driver, or only visible activity?
- Could the metric encourage harmful behavior?
- Can the calculation be reproduced consistently?
- Is another metric already answering the same question?
| Weak metric | Why it is weak | Better alternative |
|---|---|---|
| Total tasks created | More tasks may indicate fragmentation rather than progress | Completed outcomes and carryover rate |
| Total meetings | Meeting volume does not show decision quality | Decisions closed and follow-ups completed |
| Average completion time | Extreme values can hide the typical experience | Median and percentile cycle time |
| Hours worked | Effort does not prove value or quality | Outcome completion, quality, and capacity usage |
| Dashboard views | Usage does not prove that decisions improved | Decision adoption and action completion |
Step 6: Create a metric dictionary
Every approved metric should have one documented definition. A dashboard brief without a metric dictionary leaves important decisions to the developer or analyst.
| Metric field | Required information |
|---|---|
| Metric name | The approved business-facing label |
| Business purpose | The decision or question the metric supports |
| Definition | What the metric means in plain language |
| Formula | The exact calculation |
| Numerator | The quantity being counted or measured |
| Denominator | The population used for a rate or ratio |
| Inclusions | Records included in the calculation |
| Exclusions | Cancelled, test, duplicate, invalid, or other excluded records |
| Time rule | Event date, creation date, completion date, or reporting date |
| Grain | Task, customer, project, day, transaction, or another base unit |
| Data source | System and fields used |
| Refresh cadence | Real time, hourly, daily, weekly, or monthly |
| Target | The approved expected result |
| Owner | The person responsible for definition and interpretation |
Example metric definition
| Metric | On-time completion rate |
|---|---|
| Purpose | Monitor whether approved delivery commitments are being met |
| Formula | Completed items on or before committed date divided by all completed items with a valid committed date |
| Inclusions | Production work completed during the reporting period |
| Exclusions | Cancelled work, test records, and items without an approved committed date |
| Time rule | Completion timestamp in the reporting time zone |
| Target | At least 90% |
| Owner | Operations director |
Define percentage points correctly
When a rate increases from 70% to 80%, the change is 10 percentage points. The relative increase is approximately 14.3%. The dashboard brief should specify which form is displayed.
Step 7: Map metrics to data sources
A metric should not be approved until the required fields and source systems are known. Data availability may change the dashboard scope or reveal that the metric cannot yet be trusted.
| Data field | Question |
|---|---|
| Source system | Which application or database is authoritative? |
| Source object | Which table, report, endpoint, file, or record type is used? |
| Required fields | Which identifiers, dates, values, statuses, and dimensions are required? |
| Join key | How are records combined across sources? |
| History | Are status changes and past values preserved? |
| Freshness | How quickly does the source update? |
| Completeness | Which records or periods may be missing? |
| Ownership | Who maintains the source? |
| Access | Who may read the underlying information? |
| Known limitation | Which issues could distort interpretation? |
Identify the system of record
Several systems may contain similar values. The brief should state which source wins when values conflict.
- CRM for approved account and opportunity status
- Project system for delivery status and owners
- Finance system for recognized revenue and actual cost
- Support platform for verified ticket status
- Analytics platform for approved event data
- Human resources system for active employee and capacity records
Do not combine values from several sources merely because one source has fewer missing records. Resolve the definition and ownership problem first.
Step 8: Define data grain and aggregation
Many dashboard errors occur because data with different grains is combined incorrectly.
| Grain | Example record |
|---|---|
| Task | One row per task |
| Project | One row per project |
| Status event | One row per status change |
| Customer | One row per customer |
| Transaction | One row per financial transaction |
| Daily snapshot | One row per item per day |
| Monthly aggregate | One row per metric, segment, and month |
The brief should specify:
- The base record represented by one row
- How records are counted
- Whether repeated events are allowed
- Which dimensions can be used safely
- How totals and subtotals are calculated
- Whether historical values are snapshots or current-state records
- Which metrics may not be added together
Step 9: Define time, date, and comparison rules
Every metric needs a clear reporting period and date rule. “This month” can mean creation date, completion date, invoice date, or payment date.
- Reporting time zone
- Week start day
- Calendar or fiscal month
- Calendar or fiscal quarter
- Event date used for inclusion
- Partial-period treatment
- Late-arriving data treatment
- Historical correction policy
- Previous-period comparison
- Year-over-year comparison
- Rolling average or rolling total rules
Choose fair comparisons
| Comparison | Use when | Risk |
|---|---|---|
| Previous period | Operations are relatively stable | Seasonality may distort the comparison |
| Same period last year | Seasonal patterns matter | Process or product changes may reduce comparability |
| Approved target | A realistic operating standard exists | An outdated target may encourage the wrong behavior |
| Baseline | A change or pilot is being evaluated | The baseline period may be unusual |
| Forecast | Planning and capacity decisions are required | Forecast assumptions may be uncertain |
Step 10: Design dashboard views around decisions
Do not place every metric on one screen. Group information according to the user’s decision sequence.
Recommended view structure
- Overview: Key outcomes, target status, exceptions, and required decisions.
- Flow: Intake, work in progress, throughput, cycle time, and waiting stages.
- Capacity: Available capacity, assigned workload, utilization, and overload.
- Quality: Acceptance, errors, rework, returns, and unresolved defects.
- Delivery: Commitments, deadlines, overdue work, and forecast risk.
- Blockers: Open dependencies, blocker age, owner, and escalation status.
- Financial: Cost, budget, margin, or unit economics when authorized.
- Detail: Record-level investigation and export.
Define every visual component
| Component field | Required definition |
|---|---|
| Title | What the visual shows |
| Decision supported | Why the component exists |
| Metric | Approved metric dictionary reference |
| Comparison | Target, period, baseline, or forecast |
| Dimensions | Team, owner, product, region, stage, or other breakdown |
| Default period | The initial time range displayed |
| Interaction | Filter, drill-down, tooltip, detail view, or export |
| Empty state | What appears when no valid data exists |
| Data-quality note | How missing or stale data is shown |
Step 11: Select the right visual form
| Analytical need | Useful visual |
|---|---|
| Current result against target | KPI card with value, target, variance, and trend |
| Change over time | Line chart |
| Compare categories | Sorted bar chart |
| Show composition | Stacked bar chart when categories are limited |
| Show distribution | Histogram, box plot, or percentile table |
| Show process stages | Stage table, flow view, or funnel when stages are sequential |
| Investigate records | Detailed table with filters and links |
| Show workload by owner | Capacity table or grouped bar chart |
Avoid using a pie chart when users need to compare many similar categories. Avoid using a single average when the distribution or extreme cases determine the operational risk.
Step 12: Define filters and drill-down paths
Filters should help users explain a result or narrow an action. Too many filters create confusion and inconsistent reporting.
Possible operational filters include:
- Reporting period
- Team
- Owner
- Project or workstream
- Customer or account
- Product or service
- Region
- Status
- Priority
- Risk level
- Work type
- Channel
For every filter, specify:
- Default value
- Available values
- Whether multiple selections are allowed
- Which visuals it affects
- Whether the selection may be saved
- Whether access rules limit available values
Define the drill-down sequence
- Detect an exception in the overview.
- Break it down by team, process stage, or segment.
- Identify the owner or contributing category.
- Open the underlying records.
- Confirm the data and context.
- Assign or record the next action.
Step 13: Define targets, thresholds, and alerts
Color and alerts should represent an approved operating rule, not a designer’s preference.
| Threshold field | Required information |
|---|---|
| Metric | The approved metric being evaluated |
| Expected range | The normal operating range |
| Warning condition | The level requiring investigation |
| Critical condition | The level requiring immediate action |
| Duration | How long the condition must remain true |
| Minimum volume | The sample required before an alert is valid |
| Owner | The person receiving and investigating the alert |
| Response | The expected investigation or action |
| Escalation | What happens when the condition remains unresolved |
Avoid noisy alerts
- Require a minimum number of records.
- Ignore normal daily variation when the decision is weekly.
- Use persistence rules for temporary spikes.
- Group related alerts.
- Do not alert when data is incomplete or stale.
- Provide the owner with context and a drill-down link.
- Review unused alerts and remove them.
Step 14: Define data freshness and quality indicators
Users should know whether the displayed result is complete, current, and trustworthy.
- Last successful refresh time
- Expected refresh cadence
- Latest source-data timestamp
- Missing-source warning
- Incomplete-period warning
- Late-arriving data note
- Known calculation limitation
- Data-quality status
| Quality check | Example rule |
|---|---|
| Completeness | At least 98% of expected source records are available |
| Uniqueness | No duplicate primary identifiers |
| Validity | Status and date values match approved formats |
| Freshness | Source update is no more than 24 hours old |
| Consistency | Project owner matches the approved reference table |
| Reconciliation | Dashboard totals match the agreed source report within tolerance |
When a quality rule fails, the dashboard should show the warning and suppress misleading alerts when appropriate.
Step 15: Define access and privacy requirements
Operations dashboards may contain customer information, employee workload, financial data, service performance, or private project details. Access must reflect the business need.
- Who may open the dashboard?
- Who may see individual-level records?
- Who may see financial measures?
- Should managers see only their teams?
- Should account owners see only their accounts?
- Which fields must be hidden or aggregated?
- Who may export data?
- How long are historical records retained?
- Which access events should be logged?
Use the minimum necessary detail
An executive dashboard may need team-level workload without showing every employee’s individual activity. A client-facing dashboard may need account results without exposing internal cost, comments, or unrelated customers.
Step 16: Assign ownership
A dashboard needs more than a developer. Assign ownership for definitions, source systems, data quality, dashboard operation, and business actions.
| Role | Responsibility |
|---|---|
| Business owner | Approves purpose, decisions, targets, and users |
| Metric owner | Approves definition and interpretation |
| Source-system owner | Maintains the authoritative operational data |
| Data owner | Approves access, quality, and usage rules |
| Analyst | Validates requirements, calculations, and comparisons |
| Dashboard developer | Implements the approved brief |
| Quality owner | Monitors tests, reconciliation, and refresh failures |
| Action owner | Investigates exceptions and records the response |
The same person may hold several roles in a small team, but each responsibility should remain explicit.
Step 17: Create an implementation-ready dashboard brief
The final brief should contain enough information for a developer or analyst to estimate, design, build, and test the dashboard without inventing business logic.
Recommended brief structure:
- Dashboard name: Clear working title.
- Purpose: Decisions and outcomes supported.
- Scope: Teams, processes, products, and periods included.
- Users: Roles, needs, and access levels.
- Decision questions: Questions the dashboard must answer.
- Metric dictionary: Definitions, formulas, sources, targets, and owners.
- Data map: Sources, fields, joins, freshness, and limitations.
- Views: Pages, components, filters, and drill-downs.
- Thresholds: Warning, critical, and alert rules.
- Quality rules: Validation and reconciliation checks.
- Security: Access, row-level restrictions, exports, and sensitive fields.
- Acceptance criteria: Conditions required before launch.
- Ownership: Business, metric, data, dashboard, and action owners.
- Open questions: Missing decisions or unavailable data.
- Out of scope: Requests intentionally excluded from the first version.
Example dashboard component brief
| Component | Projects at delivery risk |
|---|---|
| User | Operations lead |
| Decision | Choose which projects require escalation or capacity changes |
| Metric | Count of active projects meeting the approved risk rule |
| Risk rule | Forecast completion is later than the committed date, or an unresolved critical blocker exists |
| Default view | Current active projects |
| Breakdowns | Owner, team, customer, service line, and risk reason |
| Drill-down | Project detail with committed date, forecast, blocker, owner, and next action |
| Refresh | Every four hours |
| Owner | Operations director |
Step 18: Validate the brief before development
Business users, analysts, data owners, and developers should review the brief together before implementation begins.
- Every dashboard element supports a documented decision.
- The intended users and access levels are clear.
- Each metric has one approved definition.
- Numerators, denominators, inclusions, and exclusions are documented.
- Time zones, periods, and comparison rules are explicit.
- Data sources and required fields exist.
- The grain and join rules are understood.
- Targets and thresholds have business owners.
- Data-quality failures are visible.
- Filters and drill-downs support real investigations.
- Sensitive information is protected.
- Refresh expectations are realistic.
- Open questions and unavailable metrics are not hidden.
- The first version has a controlled scope.
- Acceptance tests can be executed.
Use a traceability check
Every component should be traceable through this chain:
Business outcome
→ Decision
→ Business question
→ Metric
→ Definition
→ Source data
→ Dashboard component
→ Owner
→ Action
When a component cannot be connected to this chain, reconsider whether it belongs in the dashboard.
Step 19: Define acceptance criteria
The brief should state how the team will decide whether the dashboard is ready to launch.
- Metric results match approved source calculations.
- Totals reconcile within the agreed tolerance.
- Filters return the expected records.
- Access restrictions work for every user role.
- Refresh completes within the expected time.
- Missing or stale data displays a clear warning.
- Threshold colors match the approved business rules.
- Alert recipients and routing are correct.
- Drill-down records explain the summarized result.
- Empty states do not display false zeros.
- Definitions and last-refresh information are accessible.
- Users can complete the intended decision task.
Step 20: Launch with a controlled pilot
Release the first version to a small group of real users. Observe how they interpret the dashboard and which actions they take.
- Can users find the answer to each priority question?
- Do they interpret the metric definitions correctly?
- Which filters or views are ignored?
- Which questions still require manual analysis?
- Do users trust the numbers?
- Which alerts create useful action?
- Which visual elements cause confusion?
- Does the dashboard reduce separate spreadsheets and reports?
Do not expand the dashboard immediately when a user requests another chart. First determine which decision the request supports and whether an existing view can answer it.
Measure whether the dashboard is useful
Dashboard success is not the number of charts, users, or page views. Measure whether it improves operational decisions and follow-through.
- Requirement acceptance rate: Percentage of proposed requirements approved without major correction.
- Metric-definition correction rate: Percentage changed during analyst or owner review.
- Data-readiness rate: Percentage of approved metrics supported by usable data.
- Reconciliation accuracy: Difference between dashboard and approved source results.
- Refresh reliability: Percentage of scheduled refreshes completed successfully.
- Decision completion: Percentage of dashboard-supported decisions completed as intended.
- Exception response time: Time between detecting a problem and assigning an action.
- Action completion rate: Percentage of dashboard-generated follow-ups completed.
- Unused-component rate: Percentage of views or visuals that do not support active decisions.
- Manual-report reduction: Number of separate reports or spreadsheets retired.
- User trust: Whether operators accept the results as reliable enough to act on.
- Decision usefulness: Whether users make faster or better operational choices.
Copy-and-use prompts
Business-question clarification prompt
You are helping me prepare an operations dashboard brief.

Dashboard request:
[PASTE THE ORIGINAL REQUEST]

Business process:
[DESCRIBE THE PROCESS]

Intended users:
[USERS]

Known problems:
[PROBLEMS]

Decisions the team currently makes:
[DECISIONS]

Existing reports and tools:
[TOOLS]

Turn the request into:

1. Dashboard purpose
2. Operational scope
3. Intended users
4. Decision questions for each user
5. Actions supported by each question
6. Required reporting frequency
7. Information that should not be included
8. Missing business context
9. Stakeholders who must approve the brief
10. Questions requiring human clarification

Rules:
- Do not invent business goals or users
- Do not recommend charts yet
- Separate monitoring, diagnosis, planning, and accountability needs
- Reject questions that do not lead to a decision or action
- Mark conflicts between stakeholder requests
Metric-definition prompt
Create proposed metric definitions for these approved dashboard questions.

Business questions:
[QUESTIONS]

Operational process:
[PROCESS]

Known data sources:
[SOURCES]

Approved targets or service levels:
[TARGETS]

For each proposed metric, return:

1. Metric name
2. Business purpose
3. Decision supported
4. Plain-language definition
5. Formula
6. Numerator
7. Denominator
8. Inclusions
9. Exclusions
10. Time field used
11. Reporting grain
12. Dimensions
13. Comparison
14. Target or threshold
15. Data source
16. Refresh cadence
17. Metric owner
18. Known limitation
19. Missing information
20. Human approval required

Rules:
- Do not invent targets, fields, or source availability
- Do not use a metric merely because it is common
- Separate volume, speed, quality, capacity, cost, outcome, and risk
- Identify possible vanity metrics
- Show when averages may hide important variation
- Keep mandatory business definitions visible
Data-readiness prompt
Evaluate data readiness for this proposed dashboard.

Approved metrics:
[METRICS]

Available source documentation:
[SOURCES]

Known fields:
[FIELDS]

Refresh schedules:
[REFRESH]

Access rules:
[ACCESS]

For each metric, return:

1. Required source systems
2. Required objects or tables
3. Required fields
4. Reporting grain
5. Join keys
6. Historical data requirement
7. Expected freshness
8. Data owner
9. Access restriction
10. Known quality issue
11. Missing field or source
12. Readiness status:
   - ready
   - ready with limitation
   - requires data work
   - unavailable
13. Recommended next action
14. Human owner

Check for:
- Conflicting systems of record
- Missing history
- Duplicate records
- Incompatible grains
- Missing identifiers
- Time-zone conflicts
- Incomplete periods
- Unavailable targets
- Sensitive fields
- Unrealistic refresh expectations

Do not claim that a metric is available merely because a similar field exists.
Dashboard-view design prompt
Create a proposed dashboard-view structure from these approved requirements.

Dashboard purpose:
[PURPOSE]

Users and decisions:
[USERS AND DECISIONS]

Approved metrics:
[METRICS]

Available dimensions:
[DIMENSIONS]

Access rules:
[ACCESS]

Create:

1. Recommended dashboard pages
2. Purpose of each page
3. Primary user
4. Decision supported
5. Components on each page
6. Metric shown in each component
7. Recommended comparison
8. Recommended visual form
9. Default reporting period
10. Filters
11. Drill-down path
12. Empty state
13. Data-quality warning
14. Access limitation
15. Components that should not be included

Rules:
- Do not place every metric on one page
- Do not recommend a visual without a decision purpose
- Prefer clear comparisons over decorative charts
- Avoid averages when distributions matter
- Limit filters to useful investigations
- Keep executive and analyst needs separate
- Preserve the approved metric definitions
Dashboard brief generation prompt
Create an implementation-ready operations dashboard brief.

Approved purpose:
[PURPOSE]

Scope:
[SCOPE]

Users:
[USERS]

Decision questions:
[QUESTIONS]

Approved metrics:
[METRIC DICTIONARY]

Data map:
[DATA SOURCES]

Views:
[VIEWS]

Thresholds:
[THRESHOLDS]

Access rules:
[ACCESS]

Owners:
[OWNERS]

Create:

1. Dashboard name
2. Purpose and expected outcome
3. In-scope and out-of-scope areas
4. Users and access levels
5. Decision-question register
6. Metric dictionary
7. Data-source map
8. Reporting grain and time rules
9. Dashboard pages and components
10. Filters and drill-downs
11. Targets, thresholds, and alerts
12. Freshness and data-quality indicators
13. Security and export rules
14. Ownership model
15. Acceptance criteria
16. Open questions
17. Dependencies
18. Pilot plan
19. Success metrics

Rules:
- Do not invent missing business rules
- Mark unresolved requirements clearly
- Keep metric definitions traceable to sources
- Do not hide unavailable data
- Do not add vanity metrics
- Do not create alerts without owners and actions
- Make every dashboard component traceable to a decision
Dashboard brief quality-control prompt
Review this proposed operations dashboard brief before development begins.

Business context:
[CONTEXT]

Approved decisions:
[DECISIONS]

Source documentation:
[SOURCES]

Proposed dashboard brief:
[BRIEF]

Check for:

1. Components without a documented decision
2. Vanity metrics
3. Duplicate or conflicting metric definitions
4. Missing numerators, denominators, inclusions, or exclusions
5. Unclear time fields or reporting periods
6. Incompatible data grains
7. Unverified data sources
8. Missing targets or owners
9. Thresholds without approved actions
10. Filters that do not support investigation
11. Averages hiding important variation
12. Missing freshness or quality warnings
13. Sensitive information exposed too broadly
14. Unrealistic refresh expectations
15. Missing acceptance criteria
16. Open questions hidden as assumptions
17. Executive and analyst requirements mixed together
18. Components that cannot be traced to an outcome

Return:
- Blocking corrections
- Important corrections
- Missing business decisions
- Missing metric definitions
- Data-readiness problems
- Access and privacy risks
- Scope reductions recommended for the first version
- Final decision:
  - ready for development
  - minor revision
  - major revision
  - additional discovery required
  - do not build yet

Do not approve the brief merely because it contains many metrics and charts.
AI operations dashboard brief checklist
- The dashboard purpose is connected to an operational outcome.
- Users and decision owners are documented.
- Every decision question supports a real action.
- The operational process and stages are understood.
- Metrics are selected from business questions, not available charts.
- Vanity and duplicate metrics are removed.
- Volume, speed, quality, capacity, cost, outcome, and risk are balanced.
- Every metric has one approved definition.
- Formulas, numerators, denominators, inclusions, and exclusions are documented.
- Reporting grain is explicit.
- Time zones and date rules are defined.
- Comparison periods are fair and consistent.
- Data sources and required fields are mapped.
- The system of record is identified.
- Join keys and historical-data needs are documented.
- Data freshness and quality limitations are visible.
- Views are organized around user decisions.
- Every visual has a documented purpose.
- Filters support real investigations.
- Drill-down paths reach actionable records.
- Targets and thresholds have approved owners.
- Alerts include a response and escalation route.
- Sensitive information uses appropriate access controls.
- Business, metric, data, dashboard, and action owners are assigned.
- Open questions and unavailable metrics remain visible.
- The first release has a controlled scope.
- Acceptance tests are documented.
- A pilot is completed before broad rollout.
Common mistakes to avoid
- Beginning with charts: Begin with users, decisions, and business questions.
- Tracking available data: Approve metrics only when they support action.
- Using undefined KPIs: Create a metric dictionary before development.
- Ignoring grain: Confirm what one record represents before aggregation.
- Using misleading averages: Show distributions or percentiles when variation matters.
- Creating excessive filters: Keep only filters that support diagnosis or action.
- Using color without rules: Connect every status to an approved threshold.
- Hiding stale data: Display refresh and quality information clearly.
- Building one page for everyone: Separate executive, operational, and analytical views.
- Launching without ownership: Assign metric, data, dashboard, and action owners.
Final guidance
A dependable AI operations dashboard brief does not begin with a request for more visibility and end with a collection of charts. It creates a traceable path from operational outcomes and decisions to metrics, definitions, data sources, views, owners, quality controls, and actions.
Use AI to organize stakeholder requests, identify missing context, draft metric definitions, map requirements, and prepare the brief. Keep business priorities, KPI approval, data ownership, access decisions, thresholds, and final implementation approval under human control.
Related guides
- Build an AI Weekly Review Workflow for Operators
- Build an AI Client Report Workflow for Agencies
- Build an AI Task Prioritization Workflow
- Browse Practical AI Workflow Guides