
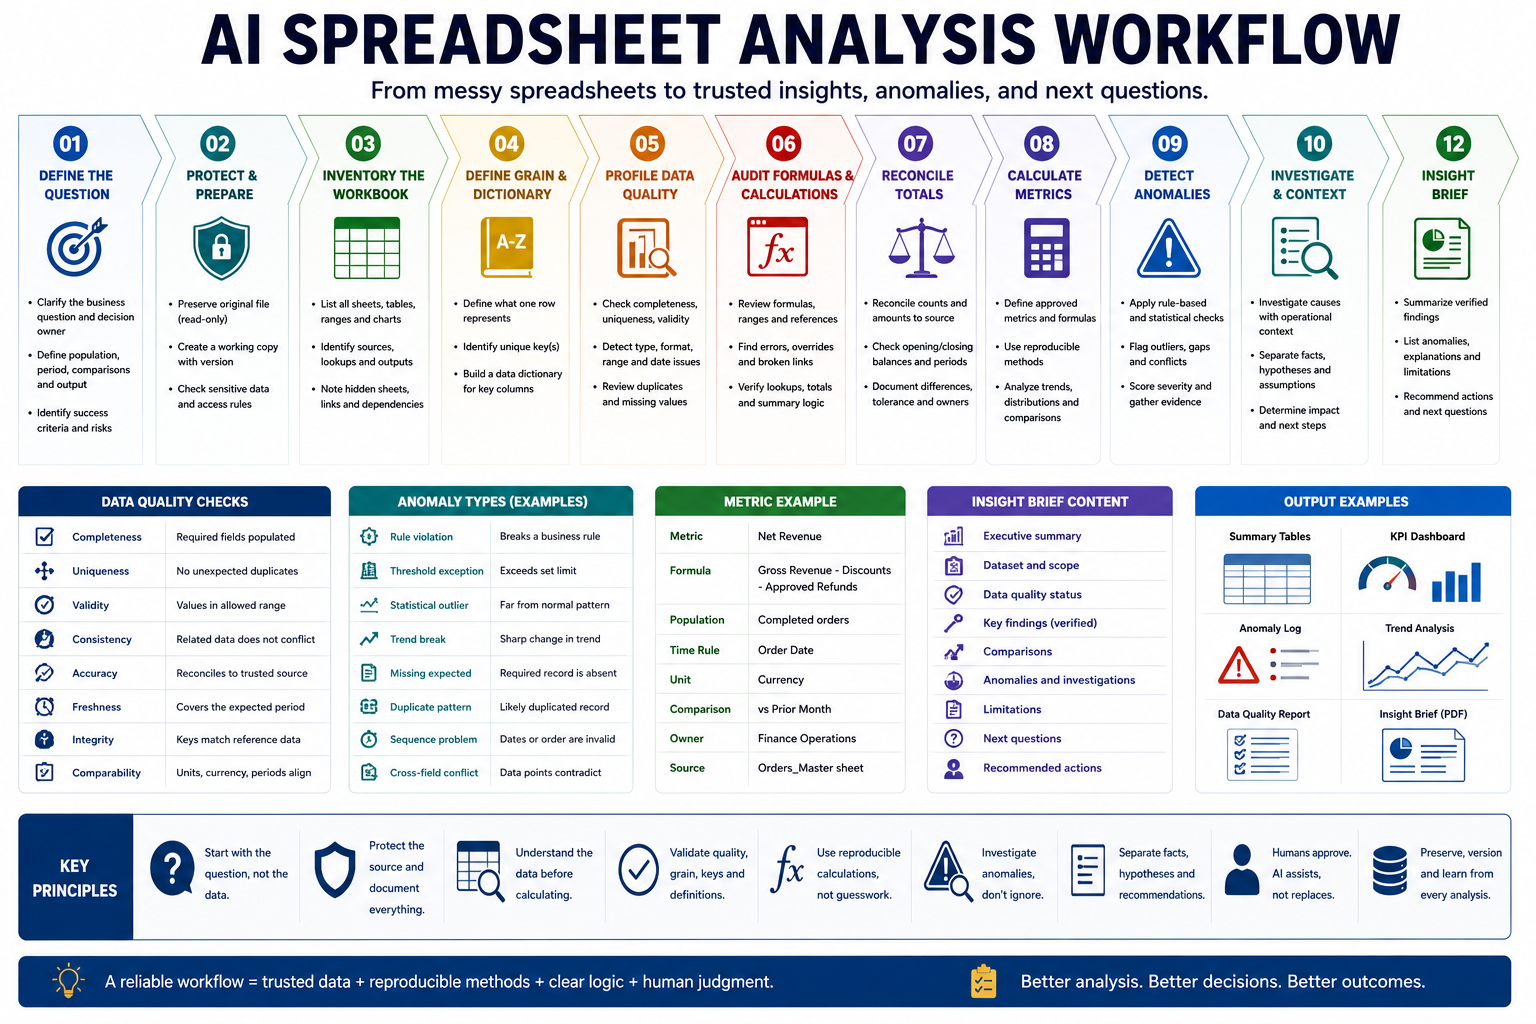
A dependable AI spreadsheet analysis workflow turns an unfamiliar workbook into a traceable analysis with verified calculations, data-quality findings, meaningful comparisons, explainable anomalies, and clearly separated facts, hypotheses, and next questions.
The goal is not to upload a spreadsheet and accept whatever summary sounds convincing. The goal is to preserve the original file, understand what each row and column represents, validate formulas and totals, perform calculations through reproducible methods, and use AI to organize findings and explain patterns without inventing missing context.
Why spreadsheet analysis produces unreliable conclusions
Spreadsheets often look structured while hiding inconsistent definitions, broken formulas, manual overrides, duplicated records, mixed reporting periods, and formatting that changes how values are interpreted.
Common failure patterns include:
- Analyzing the first visible sheet without checking the full workbook.
- Treating formatted tables as clean source data.
- Assuming one row represents one transaction when it represents a subtotal or snapshot.
- Combining currencies, time zones, units, or reporting periods.
- Reading numbers stored as text as valid numeric values.
- Ignoring hidden rows, columns, sheets, and filters.
- Using totals that exclude newly added rows.
- Accepting formulas with broken references or manual constants.
- Counting duplicated records as separate events.
- Treating blanks, zeros, and “not applicable” as equivalent.
- Calling every extreme value an error.
- Explaining anomalies without checking operational context.
- Using AI-generated calculations that cannot be reproduced.
- Publishing summaries without reconciling them to the source.
A reliable workflow should answer:
- What business question is this analysis intended to answer?
- What does one row represent?
- Which columns are authoritative inputs, formulas, labels, or notes?
- Are the records complete, unique, valid, and comparable?
- Can every result be reproduced from the source data?
- Which unusual values require investigation?
- What is known, what is inferred, and what remains unanswered?
Step 1: Define the analysis question
Do not begin by asking AI to “find insights.” Define the decision, comparison, population, period, and expected output first.
| Analysis field | Question to define |
|---|---|
| Business question | What decision or investigation should the analysis support? |
| Population | Which transactions, customers, products, projects, or periods are included? |
| Measure | Which values, rates, counts, or outcomes matter? |
| Comparison | Target, previous period, budget, forecast, baseline, or segment? |
| Time period | Which exact start and end dates apply? |
| Decision owner | Who will approve the interpretation and act on it? |
| Output | Quality report, anomaly list, trend summary, reconciliation, or decision brief? |
| Risk level | Could the result affect customers, money, compliance, staffing, or public claims? |
Turn vague requests into testable questions
| Vague request | Testable analysis question |
|---|---|
| Analyze sales | Which products and regions explain the variance between actual and budgeted revenue for the current quarter? |
| Find unusual expenses | Which approved expense records exceed category-specific limits or differ materially from the employee’s normal pattern? |
| Summarize project performance | Which projects missed their committed dates, and which blockers or ownership patterns are associated with those delays? |
| Check customer data | Which records contain duplicate identifiers, missing required fields, invalid status values, or conflicting account ownership? |
Step 2: Protect the original file and sensitive data
Preserve the original workbook before cleaning, editing, sorting, filtering, or correcting it. Analysis should occur on a controlled working copy.
- Save the original file as read-only when possible.
- Create a dated working copy with a clear version name.
- Record the file owner, source, reporting period, and collection time.
- Preserve original sheet names, formulas, comments, and metadata.
- Do not overwrite source values during cleaning.
- Record every transformation applied to the working data.
- Limit access according to the information contained in the workbook.
- Remove unnecessary personal or confidential fields before using an external AI service.
Check for sensitive content
A workbook may contain information that is not obvious from its title.
- Customer names, email addresses, phone numbers, or account identifiers
- Employee details, salaries, performance records, or attendance
- Payment, invoice, tax, banking, or transaction information
- Private notes, comments, and internal assessments
- Credentials, access tokens, or hidden connection details
- Confidential pricing, forecasts, margins, or contract terms
- Health, legal, safety, or other restricted information
Use the minimum information required for the analysis. Aggregate, redact, or replace identifiers when detailed records are unnecessary.
Step 3: Inventory the entire workbook
Before analyzing values, inspect the structure of the file. The visible sheet may depend on hidden calculations, lookup tables, imports, named ranges, or manual assumptions elsewhere in the workbook.
| Workbook element | What to record |
|---|---|
| Worksheets | Name, purpose, row count, column count, and visibility |
| Tables and ranges | Structured tables, named ranges, and manually selected ranges |
| Formulas | Formula columns, summary cells, lookups, and external references |
| Pivot tables | Source range, refresh status, filters, and calculated fields |
| Charts | Source range, displayed measure, and filters |
| Hidden content | Hidden sheets, rows, columns, and filtered-out records |
| External connections | Linked files, queries, databases, or imported data |
| Comments and notes | Manual explanations, exceptions, and assumptions |
| Macros or scripts | Automations that modify, calculate, or export data |
Create a sheet inventory
| Sheet | Purpose | Source or output | Owner | Analysis status |
|---|---|---|---|---|
| Raw_Orders | Imported order records | Source | Sales operations | Requires quality checks |
| Product_Map | Product category lookup | Reference | Commercial operations | Verify uniqueness |
| Monthly_Summary | Management totals | Calculated output | Finance analyst | Reconcile to source |
| Dashboard | Charts and KPI presentation | Presentation output | Operations lead | Do not use as raw data |
Step 4: Define what one row represents
The row grain determines how records may be counted, joined, filtered, and summarized. Never assume the grain from the column names alone.
| Possible grain | Example |
|---|---|
| Transaction | One row per invoice line or payment |
| Order | One row per customer order |
| Customer | One row per customer account |
| Task | One row per work item |
| Status event | One row per status change |
| Daily snapshot | One row per item per day |
| Monthly aggregate | One row per segment and month |
| Subtotal | One row summarizing several detailed records |
Mixing transaction rows with subtotals can double-count values. Combining current-state records with historical snapshots can multiply the number of customers, projects, or balances.
Identify a unique record key
Document the field or combination of fields that should uniquely identify one record.
- Transaction ID
- Order ID plus line number
- Customer ID
- Project ID plus snapshot date
- Employee ID plus payroll period
- Invoice number plus item code
When no reliable key exists, the workflow should report that limitation rather than silently treating every row as unique.
Step 5: Create a data dictionary
A data dictionary records what each column means, where it comes from, how it is formatted, and whether it may be used in calculations.
| Column field | Required information |
|---|---|
| Column name | The exact spreadsheet header |
| Business meaning | What the value represents |
| Data type | Text, integer, decimal, date, datetime, Boolean, or category |
| Unit | Currency, percentage, minutes, items, kilograms, or another unit |
| Source | System, form, user entry, lookup, or formula |
| Allowed values | Approved categories, range, or format |
| Blank meaning | Missing, unknown, not applicable, not yet entered, or zero |
| Formula | Calculation rule when the column is derived |
| Owner | Person responsible for definition and quality |
| Sensitivity | Public, internal, confidential, or restricted |
Example data-dictionary record
| Column | Net_Revenue |
|---|---|
| Meaning | Recognized revenue after discounts and approved refunds |
| Type | Decimal |
| Currency | Currency defined in the Currency_Code column |
| Formula | Gross revenue minus discount minus approved refund |
| Blank meaning | Calculation unavailable because a required source value is missing |
| Owner | Finance operations |
Step 6: Profile data quality before analysis
Measure the quality of the data before calculating business results. Quality findings should remain separate from performance findings.
| Quality dimension | Check |
|---|---|
| Completeness | Required fields are populated |
| Uniqueness | Record keys are not duplicated unexpectedly |
| Validity | Values follow the approved format and range |
| Consistency | Related columns and sheets do not conflict |
| Accuracy | Values reconcile to authoritative sources when available |
| Freshness | Records cover the expected reporting period |
| Referential integrity | Identifiers match valid reference records |
| Comparability | Units, definitions, and periods are compatible |
Profile each column
- Total row count
- Blank count and blank percentage
- Distinct-value count
- Duplicate count
- Minimum and maximum
- Median and relevant percentiles
- Most common categories
- Invalid values
- Unexpected data types
- Earliest and latest dates
- Formula versus constant count
A column that appears numeric may contain currency symbols, spaces, commas, dashes, error values, or text comments. Do not calculate until the type has been verified.
Step 7: Normalize types, units, dates, and categories
Formatting is not the same as stored value. Standardize the data on the working copy while preserving the original representation.
Numbers and percentages
- Distinguish decimal values from formatted percentages.
- Confirm whether 15 means 15 units, 15%, or 0.15.
- Remove thousands separators only after identifying the locale.
- Keep original precision when rounding is not part of the business rule.
- Do not convert blanks into zero automatically.
Dates and time
- Confirm day-month-year versus month-day-year formats.
- Separate dates from datetimes.
- Document the reporting time zone.
- Identify dates stored as text.
- Check for impossible or default dates.
- Confirm which date controls inclusion in the analysis.
Currencies and units
- Keep currency code separate from numeric amount.
- Do not add different currencies without an approved conversion rule.
- Record the exchange-rate source and effective date when conversion is required.
- Standardize units such as minutes and hours before aggregation.
- Separate quantities, prices, rates, and percentages.
Categories
Standardize labels without hiding the original values.
| Original values | Normalized value |
|---|---|
| Complete, Completed, Done | Completed |
| In progress, In-Progress, WIP | In Progress |
| UK, United Kingdom, GB | United Kingdom |
| N/A, Not applicable | Not Applicable |
Do not combine categories whose business meanings differ merely because their labels appear similar.
Step 8: Audit formulas and calculated cells
Calculated values should be inspected before they are used as evidence. A workbook may contain correct-looking outputs generated by incomplete ranges or inconsistent formulas.
- Identify cells containing formulas and cells containing hard-coded values.
- Check whether formulas are consistent down each calculated column.
- Find formulas that reference blank, deleted, or incorrect cells.
- Inspect absolute and relative references.
- Check whether new rows fall outside fixed calculation ranges.
- Identify hidden error handling that converts errors into zero or blank.
- Review lookup formulas for duplicate or missing keys.
- Confirm whether subtotals include filtered or hidden rows.
- Check external workbook references and their update status.
- Confirm whether calculated values have been replaced manually.
Common formula risks
| Risk | Example |
|---|---|
| Incomplete range | A total stops at row 500 while new records extend to row 620 |
| Inconsistent formula | One row uses gross value while the rest use net value |
| Broken lookup | A missing key returns an empty string and hides the error |
| Manual override | A calculated result is replaced with a typed value |
| Circular reference | A summary depends directly or indirectly on itself |
| Stale external link | The workbook displays values from an older linked file |
Do not assume that a displayed value is reliable because the spreadsheet application shows no visible error.
Step 9: Reconcile the workbook to trusted totals
Before interpreting trends, confirm that the working dataset agrees with an approved source or control total.
| Reconciliation | Example |
|---|---|
| Record count | Workbook transaction count matches the source-system export |
| Financial total | Invoice amount agrees with the approved ledger report |
| Customer count | Distinct active customers match the CRM control total |
| Period coverage | Earliest and latest records match the requested dates |
| Category totals | Segment totals add to the approved overall value |
| Opening and closing balance | Opening balance plus movement equals closing balance |
Record the difference, permitted tolerance, explanation, and owner when reconciliation does not match.
Step 10: Separate source data, transformations, and outputs
A reproducible workbook should make the analysis path visible.
- Source layer: Original imported or entered records.
- Reference layer: Approved mappings, categories, and targets.
- Transformation layer: Cleaning, standardization, joins, and derived fields.
- Analysis layer: Metrics, comparisons, distributions, and anomaly rules.
- Presentation layer: Tables, charts, and written summaries.
Do not mix manual comments, source values, and calculated results inside the same column. Keep transformation steps documented and repeatable.
Step 11: Calculate approved metrics through reproducible methods
Use spreadsheet formulas, queries, scripts, or another deterministic calculation method for exact results. AI may help draft formulas or explain outputs, but every number should be reproducible independently.
| Metric requirement | Required definition |
|---|---|
| Metric name | The approved business label |
| Formula | The exact calculation |
| Numerator | The measured quantity |
| Denominator | The population used for a rate |
| Inclusions | Records included in the result |
| Exclusions | Cancelled, test, duplicate, invalid, or incomplete records |
| Time rule | The date determining the reporting period |
| Unit | Count, currency, percentage, hours, or another unit |
| Comparison | Target, budget, baseline, forecast, or previous period |
| Owner | The person approving the metric definition |
Use distributions, not only averages
An average may hide the experience of most records or a small set of serious exceptions. Depending on the question, calculate:
- Count
- Sum
- Mean
- Median
- Minimum and maximum
- Percentiles
- Standard deviation
- Interquartile range
- Category distribution
- Period-over-period change
- Rate with a clear denominator
Step 12: Compare results fairly
Every comparison should use compatible definitions, populations, and time periods.
| Comparison | Useful when | Risk |
|---|---|---|
| Previous period | The operation is stable and seasonality is limited | Periods may have different numbers of working days |
| Same period last year | Seasonality matters | Definitions or processes may have changed |
| Budget | Financial control is required | The budget may be outdated or built on different assumptions |
| Target | An approved operating standard exists | The target may not fit every segment |
| Forecast | Expected performance needs review | The forecast may contain uncertain assumptions |
| Segment | Different customer, product, or team experiences matter | Small groups may create unstable results |
Label partial periods clearly. Do not compare a full month with an incomplete month without an approved adjustment.
Step 13: Define anomaly rules before flagging records
An anomaly is a value or pattern requiring investigation. It is not automatically an error, fraud, or operational failure.
Use several anomaly types:
| Anomaly type | Example |
|---|---|
| Rule violation | A negative quantity where only positive quantities are permitted |
| Threshold exception | An expense exceeds the approved category limit |
| Statistical outlier | A value is far outside the normal distribution |
| Trend break | A previously stable series changes sharply |
| Missing expected record | A scheduled monthly submission is absent |
| Duplicate pattern | The same identifier, amount, and date appear more than once |
| Sequence problem | A completion date occurs before the start date |
| Cross-field conflict | Status is completed while completion date is blank |
| Segment deviation | One region differs materially from comparable regions |
Document every anomaly rule
| Rule field | Required information |
|---|---|
| Rule name | Clear description of the exception |
| Population | Records eligible for the check |
| Condition | The exact formula or threshold |
| Minimum volume | Sample required before the rule applies |
| Severity | Informational, review, urgent, or critical |
| Evidence | Fields supporting the flag |
| Owner | Person responsible for investigation |
| Expected action | Verify, correct, explain, approve, or escalate |
A statistical threshold should not override an approved business rule. A rare value may be valid, while a common value may still violate policy.
Step 14: Investigate anomalies with context
AI can group unusual records and suggest questions, but a human should verify the source and operational context before a conclusion is recorded.
| Investigation field | Question |
|---|---|
| Flagged record | Which row, identifier, or group triggered the rule? |
| Rule triggered | Why was it selected? |
| Source evidence | What original values support the flag? |
| Comparison | How does it differ from peers, history, or policy? |
| Possible explanation | Which hypotheses are consistent with the evidence? |
| Verification required | Which system, document, or owner can confirm the explanation? |
| Impact | What decision, total, customer, or process is affected? |
| Disposition | Valid exception, data error, formula error, duplicate, unresolved, or approved adjustment? |
Separate facts from hypotheses
| Statement type | Example |
|---|---|
| Fact | Record 418 contains an amount 4.7 times above the category median |
| Hypothesis | The amount may represent an annual rather than monthly charge |
| Verification | Compare the record with the source invoice and contract |
| Conclusion | The record is valid and should be classified as an annual subscription |
Do not convert a plausible hypothesis into a confirmed explanation without supporting evidence.
Step 15: Use visualizations to answer defined questions
Charts should support comparison, distribution, trend, or investigation. They should not replace the underlying calculations or quality notes.
| Analytical need | Useful visual |
|---|---|
| Trend over time | Line chart |
| Compare categories | Sorted bar chart |
| Show distribution | Histogram or box plot |
| Compare actual with target | KPI table or variance chart |
| Investigate records | Detailed table with identifiers and filters |
| Show relationship | Scatter plot when both variables are suitable |
| Show composition | Stacked bar chart with a limited number of categories |
Include the reporting period, units, filters, source, and data-quality limitation with every decision-critical visual.
Step 16: Build a traceable insight brief
The final summary should distinguish verified results, quality limitations, anomalies, hypotheses, and next questions.
- Analysis question: The decision or investigation supported.
- Dataset: File, sheets, period, population, and row grain.
- Quality status: Missing, duplicate, invalid, stale, or conflicting records.
- Reconciliation: Whether totals agree with approved controls.
- Verified findings: Reproducible calculations and comparisons.
- Anomalies: Flagged records, rules, severity, and status.
- Possible explanations: Hypotheses requiring verification.
- Limitations: Missing data, weak definitions, and sample restrictions.
- Next questions: Additional evidence or analysis required.
- Actions: Owners, deadlines, and expected outcomes.
Example insight record
| Finding | Median delivery time increased from 4.2 to 6.1 days |
|---|---|
| Population | Completed standard orders in the current and previous full months |
| Evidence | 1,842 current-period records and 1,779 previous-period records |
| Primary concentration | Orders routed through Warehouse C |
| Anomaly | Warehouse C contains an unusually high number of records waiting more than three days before dispatch |
| Hypothesis | A staffing or inventory constraint may be increasing pre-dispatch wait time |
| Verification | Compare staffing, inventory availability, and carrier collection records |
| Owner | Fulfilment operations manager |
Step 17: Run human quality control
An analyst or business owner should review the workbook, calculations, and summary before the results are used.
- The correct workbook version and reporting period were used.
- Every included sheet and range has a documented purpose.
- The row grain and unique key are understood.
- Column definitions and units are confirmed.
- Blanks, zeros, and not-applicable values are treated correctly.
- Duplicate records have been reviewed.
- Formula ranges and references are complete.
- Manual overrides are identified.
- Totals reconcile to approved sources.
- Calculations can be reproduced independently.
- Comparison periods and populations are compatible.
- Anomaly rules are documented.
- Extreme values are not automatically treated as errors.
- Facts and hypotheses are separated.
- Claims do not exceed the available evidence.
- Sensitive information is protected.
- Every recommended action has an owner.
Step 18: Preserve the analysis record
Store enough information for another analyst to reproduce and review the work.
- Original file and checksum or immutable copy
- Working file version
- Analysis question and scope
- Data dictionary
- Transformation log
- Formula and quality findings
- Reconciliation results
- Metric definitions
- Anomaly rules
- Approved output tables and charts
- Human reviewer and approval date
- Corrections and revised versions
Do not silently replace a previously approved workbook or result. Record what changed, why it changed, and which conclusions were affected.
Measure whether the workflow improves analysis
Success is not the number of rows processed or summaries generated. Measure accuracy, reproducibility, review effort, and decision usefulness.
- Workbook acceptance rate: Percentage of files suitable for analysis without major repair.
- Data-quality issue rate: Number of material issues per workbook or dataset.
- Formula-error rate: Percentage of reviewed formulas requiring correction.
- Reconciliation accuracy: Difference between calculated and approved control totals.
- Duplicate-detection accuracy: Percentage of duplicate flags confirmed by reviewers.
- Anomaly precision: Percentage of flagged records that require meaningful investigation.
- False-positive rate: Valid records incorrectly flagged as problematic.
- Insight correction rate: Percentage of AI-drafted findings materially changed.
- Reproducibility rate: Percentage of results reproduced by another reviewer.
- Analysis time: Time required from file intake to approved insight brief.
- Action adoption: Percentage of verified findings entering an operational decision.
- Decision usefulness: Whether the analysis improves a real business action.
Copy-and-use prompts
Workbook inventory prompt
You are helping me prepare a spreadsheet for controlled analysis.

Business question:
[QUESTION]

Workbook context:
[OWNER, SOURCE, PERIOD, AND PURPOSE]

Workbook inventory:
[PASTE SHEET NAMES, DIMENSIONS, TABLES, FORMULAS, CONNECTIONS, AND NOTES]

Create:

1. Workbook purpose summary
2. Sheet inventory
3. Likely source sheets
4. Reference and lookup sheets
5. Transformation sheets
6. Calculated output sheets
7. Presentation-only sheets
8. Hidden or external dependencies requiring review
9. Possible row grain for each source sheet
10. Possible unique keys
11. Missing documentation
12. Sheets that should not be treated as raw data
13. Human questions required before analysis

Rules:
- Do not infer business meaning from sheet names alone
- Do not assume visible sheets are complete
- Do not treat charts or summaries as source data
- Mark external links and hidden content clearly
- Keep uncertain conclusions labelled as hypotheses
Data-dictionary prompt
Create a draft data dictionary for this spreadsheet.

Analysis question:
[QUESTION]

Row grain:
[GRAIN]

Column names:
[COLUMNS]

Sample values:
[SAMPLES]

Known business definitions:
[DEFINITIONS]

For each column, return:

1. Exact column name
2. Proposed business meaning
3. Proposed data type
4. Unit or currency
5. Source type:
   - imported
   - manually entered
   - lookup
   - formula
   - unknown
6. Allowed values or expected range
7. Meaning of blank
8. Possible quality risks
9. Sensitivity level
10. Definition confidence:
   - confirmed
   - likely
   - unclear
11. Human clarification required

Rules:
- Do not invent business definitions
- Do not treat formatting as proof of data type
- Separate zero, blank, unknown, and not applicable
- Mark mixed types and ambiguous dates
- Do not assume currency from a symbol alone
Data-quality review prompt
Review this spreadsheet data-quality profile.

Analysis scope:
[SCOPE]

Row grain and key:
[GRAIN AND KEY]

Data dictionary:
[DICTIONARY]

Column profiles:
[PASTE COUNTS, BLANKS, DISTINCT VALUES, MINIMUMS, MAXIMUMS, AND TYPES]

Known validation rules:
[RULES]

Return:

1. Completeness issues
2. Duplicate-key issues
3. Invalid values
4. Type inconsistencies
5. Date and time issues
6. Currency or unit conflicts
7. Category inconsistencies
8. Referential-integrity problems
9. Stale or incomplete period risks
10. Cross-field conflicts
11. Severity:
   - informational
   - review
   - blocking
12. Affected rows or fields
13. Recommended correction or investigation
14. Human owner

Rules:
- Do not replace blanks with zero automatically
- Do not remove duplicates without verification
- Do not correct source values silently
- Separate definite errors from possible exceptions
- Preserve the original value and record identifier
Formula-audit prompt
Review this spreadsheet formula inventory.

Sheet and range:
[SHEET OR RANGE]

Expected calculation:
[BUSINESS RULE]

Formula patterns:
[PASTE FORMULAS OR FORMULA GROUPS]

Known row range:
[RANGE]

Return:

1. Formula purpose
2. Expected consistent pattern
3. Inconsistent formulas
4. Hard-coded values inside calculated ranges
5. Broken or missing references
6. Fixed ranges that may exclude new records
7. Lookup risks
8. Hidden error handling
9. External-link dependencies
10. Possible circular references
11. Cells requiring human verification
12. Recommended test calculation

Rules:
- Do not approve a formula because it returns a value
- Compare the formula with the documented business rule
- Mark uncertain findings for manual review
- Preserve exact cell references
- Do not change the workbook automatically
Analysis-planning prompt
Create a reproducible analysis plan for this spreadsheet.

Business question:
[QUESTION]

Decision owner:
[OWNER]

Dataset scope:
[SCOPE]

Row grain:
[GRAIN]

Approved columns:
[COLUMNS]

Metric definitions:
[METRICS]

Comparison:
[COMPARISON]

Known quality limitations:
[LIMITATIONS]

Create:

1. Required filters
2. Required exclusions
3. Calculations
4. Groupings and segments
5. Comparison periods
6. Distribution statistics
7. Reconciliation checks
8. Anomaly rules
9. Required output tables
10. Recommended visuals
11. Verification steps
12. Limitations to disclose
13. Questions that cannot be answered from the spreadsheet
14. Human approval points

Rules:
- Use deterministic calculations for all numbers
- Do not invent missing values
- Do not use averages when the distribution matters
- Keep quality findings separate from performance findings
- Make every result traceable to source records
Anomaly-investigation prompt
Prepare these spreadsheet anomalies for human investigation.

Analysis scope:
[SCOPE]

Approved anomaly rules:
[RULES]

Flagged records:
[RECORDS]

Comparison statistics:
[STATISTICS]

For each anomaly, return:

1. Record identifier
2. Rule triggered
3. Source values
4. Comparison value
5. Size of deviation
6. Severity
7. Possible explanations
8. Evidence supporting each explanation
9. Evidence still required
10. Potential impact
11. Recommended owner
12. Recommended disposition:
   - valid exception
   - data error
   - formula error
   - duplicate
   - approved adjustment
   - unresolved
13. Human decision required

Rules:
- Do not label an anomaly as an error without verification
- Do not allege misconduct or intent
- Separate facts from hypotheses
- Preserve the original row and source reference
- Do not hide conflicting evidence
Insight-summary prompt
Create a draft spreadsheet analysis brief for human review.

Analysis question:
[QUESTION]

Dataset summary:
[DATASET]

Quality findings:
[QUALITY]

Reconciliation results:
[RECONCILIATION]

Verified calculations:
[CALCULATIONS]

Comparisons:
[COMPARISONS]

Anomalies:
[ANOMALIES]

Known limitations:
[LIMITATIONS]

Create:

1. Executive summary
2. Dataset and scope
3. Data-quality status
4. Reconciliation status
5. Verified findings
6. Important comparisons
7. Confirmed anomalies
8. Unresolved anomalies
9. Possible explanations clearly labelled as hypotheses
10. Limitations
11. Next questions
12. Recommended actions with owners
13. Verification checklist

Rules:
- Use only supplied verified calculations
- Do not calculate new totals in prose
- Do not invent causes or missing context
- Separate facts, hypotheses, and recommendations
- Include denominators and sample sizes when relevant
- Disclose unresolved quality problems
- Do not describe correlation as proof of cause
Spreadsheet analysis quality-control prompt
Review this spreadsheet analysis before it is used.

Business question:
[QUESTION]

Source workbook documentation:
[DOCUMENTATION]

Metric definitions:
[METRICS]

Quality and reconciliation results:
[QUALITY]

Draft analysis:
[DRAFT]

Check for:

1. Wrong workbook version or period
2. Unclear row grain
3. Duplicate or subtotal records counted incorrectly
4. Blanks treated as zero
5. Mixed currencies, units, or time zones
6. Invalid date interpretation
7. Inconsistent or incomplete formulas
8. Totals that do not reconcile
9. Metrics without approved definitions
10. Mismatched comparison periods
11. Averages hiding important variation
12. Anomalies described as confirmed errors
13. Hypotheses presented as facts
14. Unsupported causal claims
15. Missing sample sizes or denominators
16. Sensitive information exposed unnecessarily
17. Results that cannot be reproduced
18. Actions without owners

Return:
- Blocking corrections
- Important corrections
- Calculations requiring reproduction
- Anomalies requiring investigation
- Claims requiring weaker language
- Missing limitations
- Final decision:
  - ready for internal use
  - minor revision
  - major revision
  - additional verification required
  - do not use

Do not approve the analysis merely because the summary sounds clear.
AI spreadsheet analysis workflow checklist
- The analysis question and decision owner are defined.
- The original workbook is preserved unchanged.
- A controlled working copy is used.
- Sensitive fields and access rules are reviewed.
- Every worksheet and hidden dependency is inventoried.
- Source, reference, transformation, analysis, and presentation sheets are separated.
- The row grain is documented.
- A unique record key is confirmed or its absence disclosed.
- A data dictionary exists for important columns.
- Blanks, zeros, unknowns, and not-applicable values are separated.
- Data types, dates, currencies, units, and categories are validated.
- Duplicate records are reviewed before removal.
- Formula patterns, ranges, lookups, and external links are checked.
- Manual overrides inside calculated areas are identified.
- Totals reconcile to an approved source.
- Every metric has a reproducible definition.
- Calculations use deterministic methods.
- Comparison periods and populations are compatible.
- Distributions are reviewed when averages may mislead.
- Anomaly rules are documented before records are flagged.
- Extreme values are investigated rather than automatically removed.
- Facts, hypotheses, and recommendations are separated.
- Every finding is traceable to source records.
- Limitations and missing data are disclosed.
- A human reviews the final calculations and interpretation.
- The analysis files, rules, and approvals are preserved.
Common mistakes to avoid
- Starting with the dashboard sheet: Identify the true source records first.
- Trusting formatting: Verify stored types and values.
- Ignoring row grain: Confirm what one row represents before counting.
- Deleting duplicates automatically: Verify whether they are errors or valid repeated events.
- Treating blanks as zero: Preserve the business meaning of missing values.
- Trusting visible formulas: Check ranges, references, lookups, and overrides.
- Using AI for exact arithmetic: Calculate through reproducible spreadsheet or code logic.
- Calling outliers errors: Investigate the operational context.
- Explaining correlation as cause: Label possible explanations as hypotheses.
- Publishing without reconciliation: Confirm totals and definitions first.
Final guidance
A dependable AI spreadsheet analysis workflow does not begin with a request for instant insights. It begins by protecting the source, understanding the workbook, documenting the row grain, validating the data, auditing formulas, and reproducing every calculation.
Use AI to organize workbook documentation, identify quality risks, prepare analysis plans, group anomalies, and draft clear explanations. Keep exact calculations, data corrections, anomaly decisions, sensitive-data handling, causal interpretation, and final approval under human control.
Related guides
- Build an AI Operations Dashboard Brief Generator
- Build an AI Weekly Review Workflow for Operators
- Build an AI Client Report Workflow for Agencies
- Browse Practical AI Workflow Guides